CalBike Complete Streets Survey Results
Many of California’s most dangerous streets for bicycling are controlled by Caltrans. This fall, CalBike asked Californians how comfortable they felt on Caltrans-controlled highways that serve as surface streets in local neighborhoods around the state. The results confirmed that Californians are desperate for solutions; a majority of respondents felt uncomfortable walking or bicycling on these Caltrans-controlled streets, and they were nearly unanimous that the roadways are hazardous for children, even with adult supervision.
This survey is part of CalBike’s review of how well Caltrans is implementing its own Complete Streets policies and whether it is meeting the needs of people who get around by bicycling, walking, or taking public transit. We hope the data is a first step to bringing meaningful change at a state agency that has too long focused on moving cars and trucks while neglecting active transportation, safety, and the climate crisis.
Traffic violence kills more than 4,000 Californians every year. A quarter of those deaths are pedestrians. It’s time for us to stop accepting this level of carnage, especially because we know how to prevent it. And, creating streets that are appealing to walk and bike on has the added benefit of reducing car trips, something California needs to do much faster to address the urgent threat of climate change. When Caltrans stands in the way of Complete Streets, it stands on the wrong side of history and against the wishes of many Californians. We need change now.
In this post, we break down the components of the statewide survey and highlight trends. In addition, we call out the state roads with the best and worst facilities for people who bike and walk.
By the Numbers:
Feel Uncomfortable or Very Uncomfortable walking/biking on Caltrans Streets
Would be uncomfortable with a child walking/biking on Caltrans streets
Would be likely to walk or bike if Caltrans implements Complete Streets components
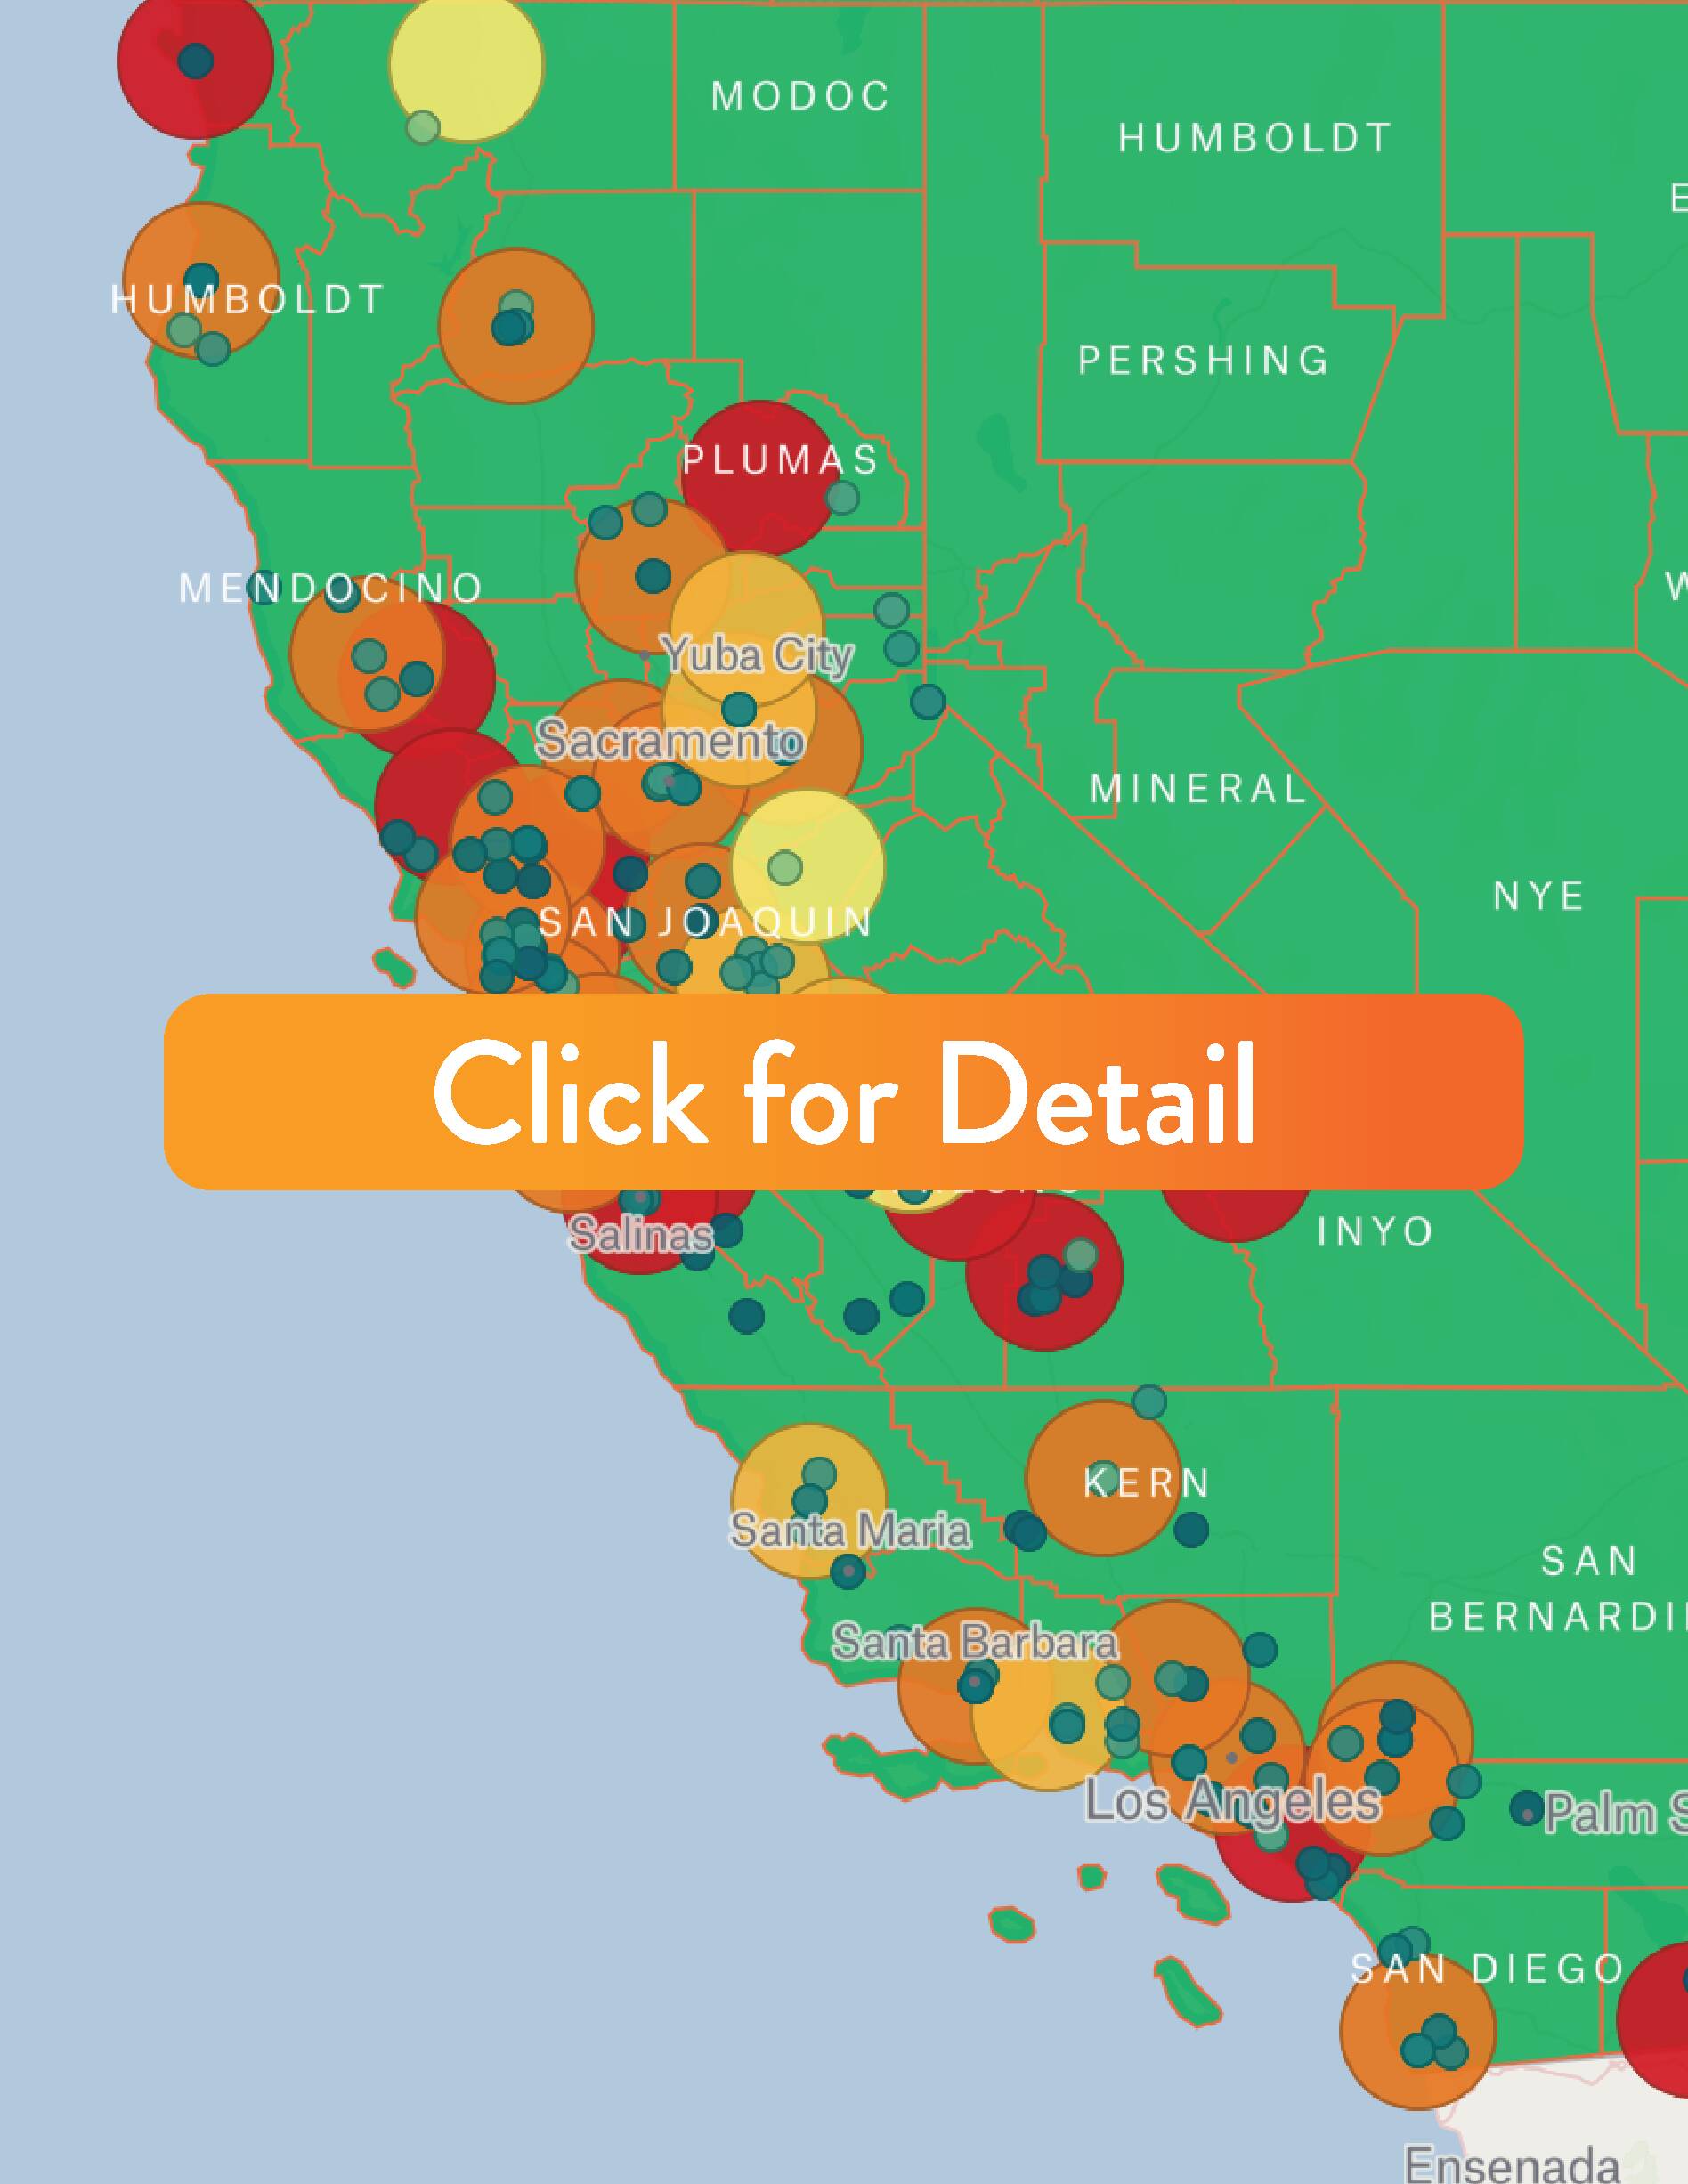
Safety Score of State Routes
Respondents were asked to rate how comfortable they felt walking or biking on selected routes they were familiar with on a scale on 1 to 4, with 4 being the least comfortable. The average score was 3.28, or “somewhat uncomfortable”, check out the map below for detailed results by county and route.
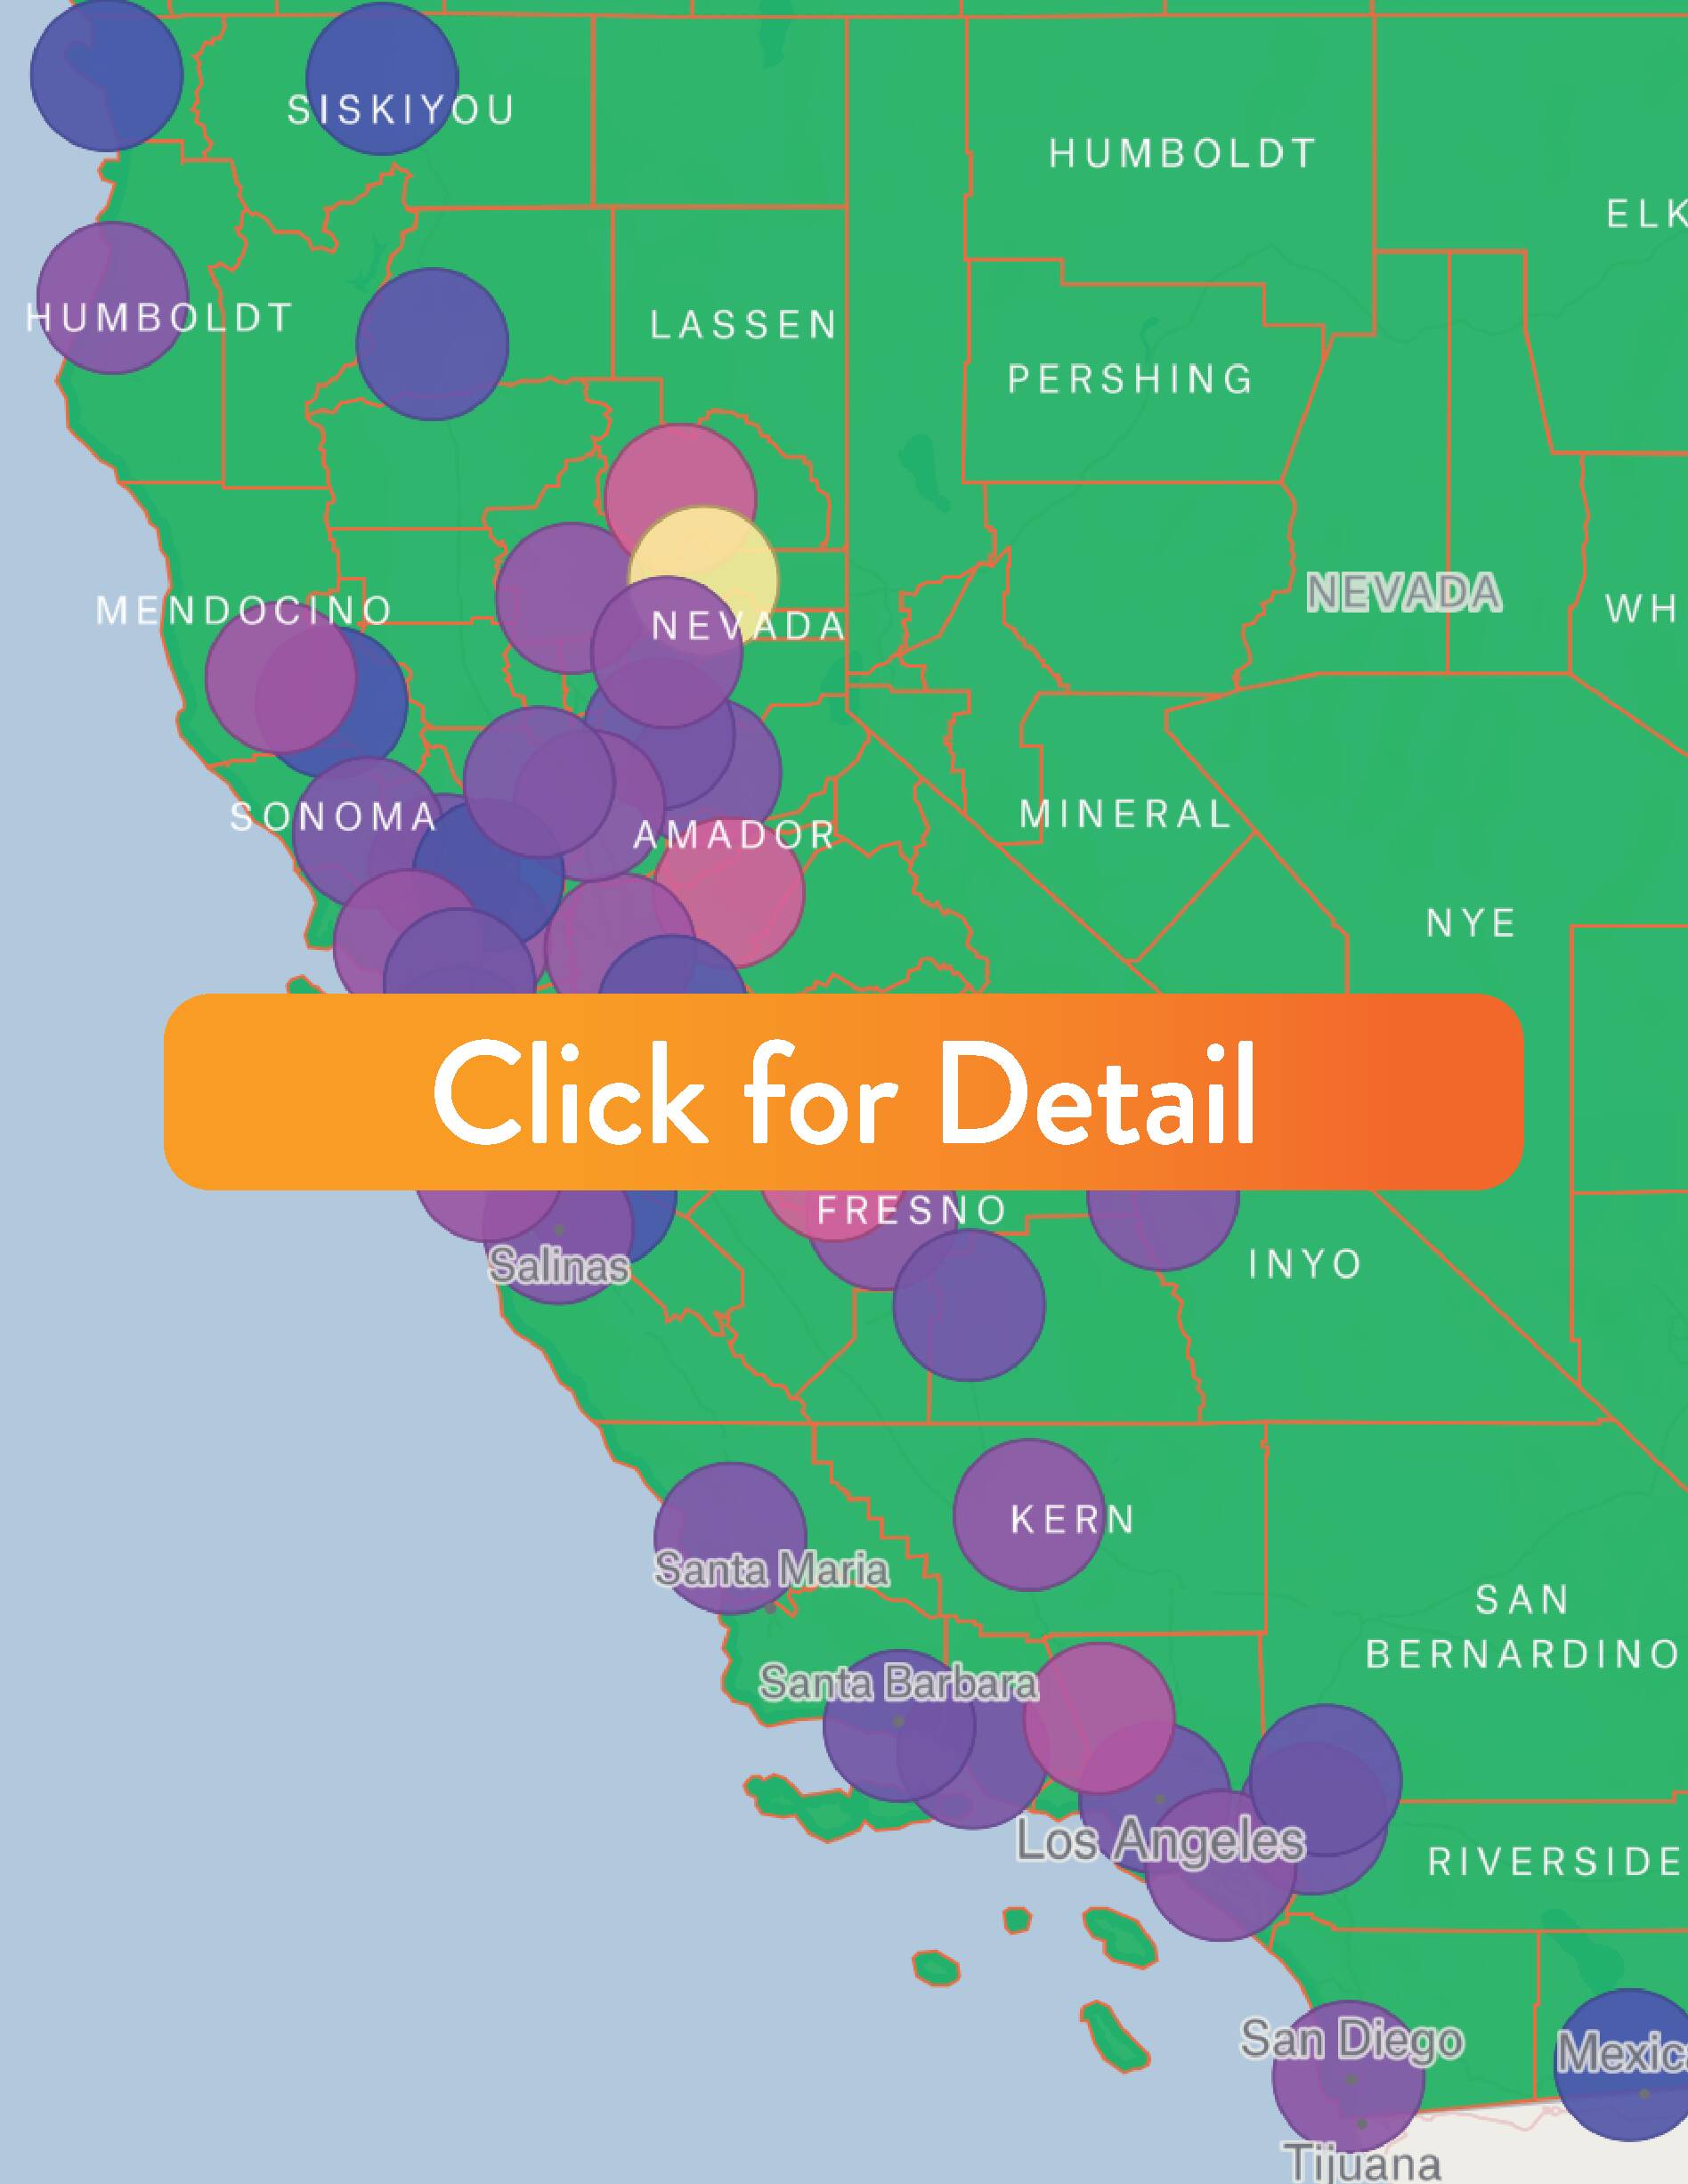
Likeliness to Ride or Walk on State Routes Score
Respondents were asked to indicate how likely on a scale of 1 to 3, they would be to utilize the roadways if Complete Streets elements were added, with 3 being the most likely. Complete Streets improvements include bike infrastructure, protected intersections, separation from traffic, and speed enforcement. A majority of respondents indicated they would be very likely to use the roadways, and the average county score came to 2.67, or very likely. Check out the map below for detailed results by county.
In their own words
Respondents were asked if they had any other feedback on the state routes that bisect their communities. Here are some of their comments.
“These highways are generally scary to bike on and crossing them on foot often feels dangerous. As a result, they segment neighborhoods and make it harder to get places on bike, foot, or transit.”
– Ian, San Francisco County
“All state routes should have parallel protected bicycle paths, wide sidewalks, and protection provisions for vulnerable road users.”
– Sasha, Contra Costa County
“I typically cross San Pablo at Virginia by bike, often with my child. Despite multiple casualties at the intersection, it’s still quite dangerous to cross. The crossing lights are great to have, but are only triggered with a pedestrian-oriented button. Even with no pedestrians on the sidewalk, it’s difficult to access via bike.”
– Ian, Alameda County
“Biking with my 3-year-old child on any of these routes is a joke.”
– Kayla, Los Angeles County
“State and local governments must plan for the future- not the present or past. Climate change will only get worse if governments fail to make the right transportation decisions today that take cars off the road. Please give people safe alternatives to driving and it will happen.”
– Anonymous, Los Angeles County
Broken promises, fractured routes
It’s more vital than ever that Californians have safe and comfortable alternatives to getting around by car, as climate change accelerates and creates multiplying hazards that affect every corner of our state. Caltrans’ historic failure to consider the needs of active transportation when building or maintaining roadways has built barriers that prevent communities from creating the connected, protected bikeways and walking routes their residents need to replace car trips with bicycling or walking. And it often fails to respond to safety concerns, even after deaths and injuries of people biking and walking.
Our user survey clearly shows that Caltrans is doing too little and moving too slowly to build Complete Streets infrastructure on its State Highway System. CalBike will continue to hold the agency to account and push for more funding for Complete Streets and prioritization of active transportation at the state level.
Methodology
CalBike conducted an online survey focusing on highways under the jurisdiction of Caltrans that function as surface streets across the state of California. The survey provided an opportunity for respondents to share feedback concerning all pertinent routes in California. In total, 2,348 people filled out the survey, providing 4,918 route evaluations collected over a 32-day period. After removing duplicates and erroneous or irrelevant submissions, we evaluated and scored the remaining 2,179 responses.


